Monitoring
Monitoring Samza Applications
This section provides details on monitoring of Samza jobs, not to be confused with Samza Monitors (components of the Samza-REST service that provide cluster-wide monitoring capabilities).
Like any other production software, it is critical to monitor the health of our Samza jobs. Samza relies on metrics for monitoring and includes an extensible metrics library. While a few standard metrics are provided out-of-the-box, it is easy to define metrics specific to your application.
- A. Metrics Reporters
- B. Metric Types in Samza
- C. Adding User-Defined Metrics
- D. Key Internal Samza Metrics
- E. Metrics Reference Sheet
A. Metrics Reporters
Samza's metrics library encapsulates the metrics collection and sampling logic. Metrics Reporters in Samza are responsible for emitting metrics to external services which may archive, process, visualize the metrics' values, or trigger alerts based on them.
Samza includes default implementations for two such Metrics Reporters:
-
a) A JMXReporter (detailed below) which allows using standard JMX clients for probing containers to retrieve metrics encoded as JMX MBeans. Visualization tools such as Grafana could also be used to visualize this JMX data.
-
b) A MetricsSnapshot reporter (detailed below) which allows periodically publishing all metrics to Kafka. A downstream Samza job could then consume and publish these metrics to other metrics management systems such as Prometheus and Graphite.
Note that Samza allows multiple Metrics Reporters to be used simultaneously.
A.1 Reporting Metrics to JMX (JMX Reporter)
This reporter encodes all its internal and user-defined metrics as JMX MBeans and hosts a JMX MBean server. Standard JMX clients (such as JConsole, VisualVM) can thus be used to probe Samza's containers and YARN-ApplicationMaster to retrieve these metrics' values. JMX also provides additional profiling capabilities (e.g., for CPU and memory utilization), which are also enabled by this reporter.
Enabling the JMX Reporter
JMXReporter can be enabled by adding the following configuration.
#Define a Samza metrics reporter called "jxm", which publishes to JMX
metrics.reporter.jmx.class=org.apache.samza.metrics.reporter.JmxReporterFactory

# Use the jmx reporter (if using multiple reporters, separate them with commas)
metrics.reporters=jmx
Using the JMX Reporter
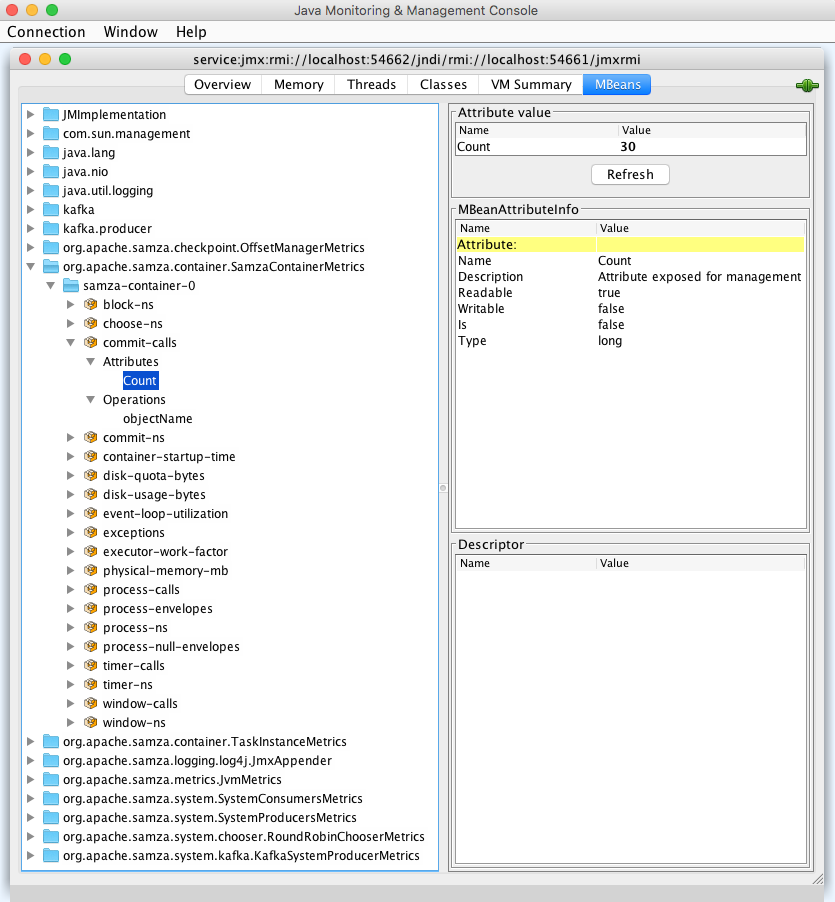
To connect to the JMX MBean server, first obtain the JMX Server URL and port, published in the container logs:
2018-08-14 11:30:49.888 [main] JmxServer [INFO] Started JmxServer registry port=54661 server port=54662 url=service:jmx:rmi://localhost:54662/jndi/rmi://localhost:54661/jmxrmi
If using the JConsole JMX client, launch it with the service URL as:
jconsole service:jmx:rmi://localhost:54662/jndi/rmi://localhost:54661/jmxrmi
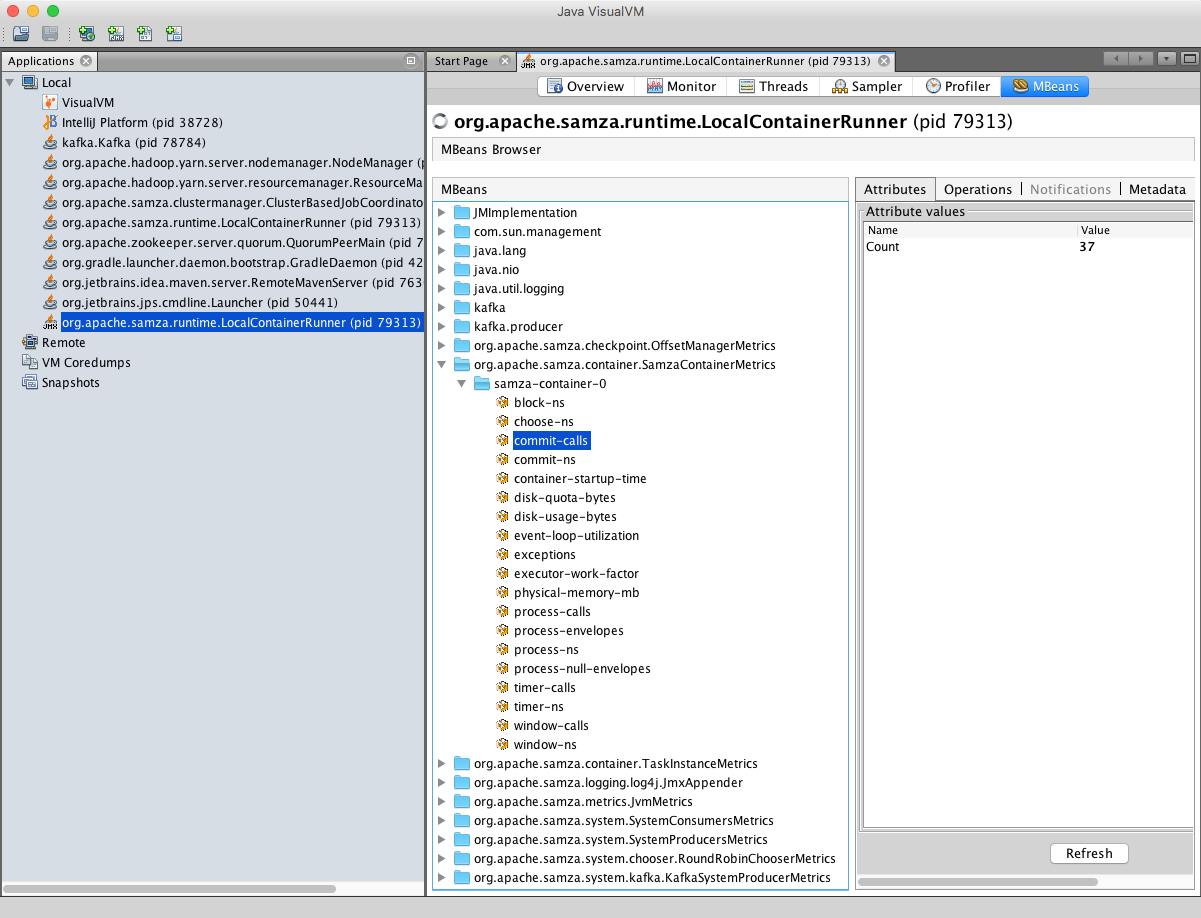
If using the VisualVM JMX client, run:
jvisualvm
After VisualVM starts, click the "Add JMX Connection" button and paste in your JMX server URL (obtained from the logs). Install the VisualVM-MBeans plugin (Tools->Plugin) to view the metrics MBeans.
A.2 Reporting Metrics to Kafka (MetricsSnapshot Reporter)
This reporter publishes metrics to Kafka.
Enabling the MetricsSnapshot Reporter
To enable this reporter, simply append the following to your job's configuration.
#Define a metrics reporter called "snapshot"
metrics.reporters=snapshot
metrics.reporter.snapshot.class=org.apache.samza.metrics.reporter.MetricsSnapshotReporterFactory
Specify the kafka topic to which the reporter should publish to
metrics.reporter.snapshot.stream=kafka.metrics
Specify the serializer to be used for the metrics data
serializers.registry.metrics.class=org.apache.samza.serializers.MetricsSnapshotSerdeFactory
systems.kafka.streams.metrics.samza.msg.serde=metrics
With this configuration, all containers (including the YARN-ApplicationMaster) will publish their JSON-encoded metrics to a Kafka topic called "metrics" every 60 seconds. The following is an example of such a metrics message:
{
  "header": {
    "container-name": "samza-container-0",

    "exec-env-container-id": "YARN-generated containerID",
    "host": "samza-grid-1234.example.com",
    "job-id": "1",
    "job-name": "my-samza-job",
    "reset-time": 1401729000347,
    "samza-version": "0.0.1",
    "source": "TaskName-Partition1",
    "time": 1401729420566,
    "version": "0.0.1"
  },
  "metrics": {
    "org.apache.samza.container.TaskInstanceMetrics": {
      "commit-calls": 1,
      "window-calls": 0,
      "process-calls": 14,

      "messages-actually-processed": 14,
      "send-calls": 0,

      "flush-calls": 1,
      "pending-messages": 0,
      "messages-in-flight": 0,
      "async-callback-complete-calls": 14,
        "wikipedia-#en.wikipedia-0-offset": 8979,
    }
  }
}
Each message contains a header which includes information about the job, time, and container from which the metrics were obtained. The remainder of the message contains the metric values, grouped by their types, such as TaskInstanceMetrics, SamzaContainerMetrics, KeyValueStoreMetrics, JVMMetrics, etc. Detailed descriptions of the various metric categories and metrics are available here.
It is possible to configure the MetricsSnapshot reporter to use a different serializer using this configuration
serializers.registry.metrics.class=<classpath-to-my-custom-serializer-factory>
To configure the reporter to publish with a different frequency (default 60 seconds), add the following to your job's configuration
metrics.reporter.snapshot.interval=<publish frequency in seconds>
Similarly, to limit the set of metrics emitted you can use the regex based blacklist supported by this reporter. For example, to limit it to publishing only SamzaContainerMetrics use:
metrics.reporter.snapshot.blacklist=^(?!.\*?(?:SamzaContainerMetrics)).\*$
A.3 Creating a Custom MetricsReporter
Creating a custom MetricsReporter entails implementing the MetricsReporter interface. The lifecycle of Metrics Reporters is managed by Samza and is aligned with the Samza container lifecycle. Metrics Reporters can poll metric values and can receive callbacks when new metrics are added at runtime, e.g., user-defined metrics. Metrics Reporters are responsible for maintaining executor pools, IO connections, and any in-memory state that they require in order to export metrics to the desired external system, and managing the lifecycles of such components.
After implementation, a custom reporter can be enabled by appending the following to the Samza job's configuration:
#Define a metrics reporter with a desired name
metrics.reporter.<my-custom-reporter-name>.class=<classpath-of-my-custom-reporter-factory>


#Enable its use for metrics reporting
metrics.reporters=<my-custom-reporter-name>
B. Metric Types in Samza
Metrics in Samza are divided into three types – Gauges, Counters, and Timers.
Gauges are useful when measuring the magnitude of a certain system property, e.g., the current queue length, or a buffer size.
Counters are useful in measuring metrics that are cumulative values, e.g., the number of messages processed since container startup. Certain counters are also useful when visualized with their rate-of-change, e.g., the rate of message processing.
Timers are useful for storing and reporting a sliding-window of timing values.
C. Adding User-Defined Metrics
To add a new metric, you can simply use the MetricsRegistry in the provided TaskContext of the init() method to register new metrics. The code snippets below show examples of registering and updating a user-defined Counter metric. Timers and gauges can similarly be used from within your task class.
Low Level Task API
Simply have your task implement the InitableTask interface and access the MetricsRegistry from the TaskContext.
public class MyJavaStreamTask implements StreamTask, InitableTask {

  private Counter messageCount;
  public void init(Config config, TaskContext context) {
    this.messageCount = context.getMetricsRegistry().newCounter(getClass().getName(), "message-count");

  }

  public void process(IncomingMessageEnvelope envelope, MessageCollector collector, TaskCoordinator coordinator) {
    messageCount.inc();
  }

}
High Level Streams API
In the High Level Streams API, you can define a ContextManager and access the MetricsRegistry from the TaskContext, using which you can add and update your metrics.
public class MyJavaStreamApp implements StreamApplication {

  private Counter messageCount = null;

  @Override
  public void init(StreamGraph graph, Config config) {
    graph.withContextManager(new DemoContextManager());
    MessageStream<IndexedRecord> viewEvent = ...;
    viewEvent
        .map(this::countMessage)
        ...;
  }

  public final class DemoContextManager implements ContextManager {

  @Override
  public void init(Config config, TaskContext context) {
      messageCount = context.getMetricsRegistry().
      newCounter(getClass().getName(), "message-count");
  }

  private IndexedRecord countMessage(IndexedRecord value) {
    messageCount.inc();
    return value;
  }

  @Override
  public void close() { }

  }
D. Key Internal Samza Metrics
Samza's internal metrics allow for detailed monitoring of a Samza job and all its components. Detailed descriptions of all internal metrics are listed in a reference sheet here. However, a small subset of internal metrics facilitates easy high-level monitoring of a job.
These key metrics can be grouped into three categories: Vital metrics, Store__metrics, and Operator metrics. We explain each of these categories in detail below.
D.1. Vital Metrics
These metrics indicate the vital signs of a Samza job's health. Note that these metrics are categorized into different groups based on the Samza component they are emitted by, (e.g. SamzaContainerMetrics, TaskInstanceMetrics, ApplicationMaster metrics, etc).
| Metric Name | Group | Meaning |
|---|---|---|
| Availability – Are there any resource failures impacting my job? | ||
| job-healthy | ContainerProcessManagerMetrics | A binary value, where 1 indicates that all the required containers configured for a job are running, 0 otherwise. |
| failed-containers | ContainerProcessManagerMetrics | Number of containers that have failed in the job's lifetime |
| Input Processing Lag – Is my job lagging ? | ||
| <Topic>-<Partition>-messages-behind-high-watermark | ||
| KafkaSystemConsumerMetrics | Number of input messages waiting to be processed on an input topic-partition | |
| consumptionLagMs | EventHubSystemConsumer | Time difference between the processing and enqueuing (into EventHub) of input events |
| millisBehindLatest | KinesisSystemConsumerMetrics | Current processing lag measured from the tip of the stream, expressed in milliseconds. |
| Output/Produce Errors – Is my job failing to produce output? | ||
| producer-send-failed | KafkaSystemProducerMetrics | Number of send requests to Kafka (e.g., output topics) that failed due to unrecoverable errors |
| flush-failed | HdfsSystemProducerMetrics | Number of failed flushes to HDFS |
| Processing Time – Is my job spending too much time processing inputs? | ||
| process-ns | SamzaContainerMetrics | Amount of time the job is spending in processing each input |
| commit-ns | SamzaContainerMetrics | Amount of time the job is spending in checkpointing inputs (and flushing producers, checkpointing KV stores, flushing side input stores). |
| The frequency of this function is configured using task.commit.ms | ||
| window-ns | SamzaContainerMetrics | In case of WindowableTasks being used, amount of time the job is spending in its window() operations |
D.2. Store Metrics
Stateful Samza jobs typically use RocksDB backed KV stores for storing state. Therefore, timing metrics associated with KV stores can be useful for monitoring input lag. These are some key metrics for KV stores. The metrics reference sheet here details all metrics for KV stores.
| Metric name | Group | Meaning |
|---|---|---|
| get-ns, put-ns, delete-ns, all-ns | KeyValueStorageEngineMetrics | Time spent performing respective KV store operations |
D.3. Operator Metrics
If your Samza job uses Samza's Fluent API or Samza-SQL, Samza creates a DAG (directed acyclic graph) of operators to form the required data processing pipeline. In such cases, operator metrics allow fine-grained monitoring of such operators. Key operator metrics are listed below, while a detailed list is present in the metrics reference sheet.
| Metric name | Group | Meaning |
|---|---|---|
| <Operator-ID>-handle-message-ns | WindowOperatorImpl, PartialJoinOperatorImpl, StreamOperatorImpl, StreamTableJoinOperatorImpl, etc | Time spent handling a given input message by the operator |
E. Metrics Reference Sheet
Suffixes "-ms" and "-ns" to metric names indicated milliseconds and nanoseconds respectively. All "average time" metrics are calculated over a sliding time window of 300 seconds.
All <system>, <stream>, <partition>, <store-name>, <topic>, are populated with the corresponding actual values at runtime.
| Group | Metric name | Meaning |
|---|---|---|
| ContainerProcessManagerMetrics | running-containers | Total number of running containers. |
| needed-containers | Number of containers needed for the job to be declared healthy. | |
| completed-containers | Number of containers that have completed their execution and exited. | |
| failed-containers | Number of containers that have failed in the job's lifetime. | |
| released-containers | Number of containers released due to overallocation by the YARN-ResourceManager. | |
| container-count | Number of containers configured for the job. | |
| redundant-notifications | Number of redundant onResourceCompletedcallbacks received from the RM after container shutdown. | |
| job-healthy | A binary value, where 1 indicates that all the required containers configured for a job are running, 0 otherwise. | |
| preferred-host-requests | Number of container resource-requests for a preferred host received by the cluster manager. | |
| any-host-requests | Number of container resource-requests for any host received by the cluster manager | |
| expired-preferred-host-requests | Number of expired resource-requests-for -preferred-host received by the cluster manager. | |
| expired-any-host-requests | Number of expired resource-requests-for -any-host received by the cluster manager. | |
| host-affinity-match-pct | Percentage of non-expired preferred host requests. This measures the % of resource-requests for which host-affinity provided the preferred host. |
| Group | Metric name | Meaning |
|---|---|---|
| SamzaContainerMetrics (Timer metrics) | choose-ns | Average time spent by a task instance for choosing the input to process; this includes time spent waiting for input, selecting one in case of multiple inputs, and deserializing input. |
| window-ns | In case of WindowableTasks being used, average time a task instance is spending in its window() operations. | |
| timer-ns | Average time spent in the timer-callback when a timer registered with TaskContext fires. | |
| process-ns | Average time the job is spending in processing each input. | |
| commit-ns | Average time the job is spending in checkpointing inputs (and flushing producers, checkpointing KV stores, flushing side input stores). The frequency of this function is configured using task.commit.ms. | |
| block-ns | Average time the run loop is blocked because all task instances are busy processing input; could indicate lag accumulating. | |
| container-startup-time | Time spent in starting the container. This includes time to start the JMX server, starting metrics reporters, starting system producers, consumers, system admins, offset manager, locality manager, disk space manager, security manager, statistics manager, and initializing all task instances. |
| Group | Metric name | Meaning |
|---|---|---|
| SamzaContainerMetrics (Counters and Gauges) | commit-calls | Number of commits. Each commit includes input checkpointing, flushing producers, checkpointing KV stores, flushing side input stores, etc. |
| window-calls | In case of WindowableTask, this measures the number of window invocations. | |
| timer-calls | Number of timer callbacks. | |
| process-calls | Number of process method invocations. | |
| process-envelopers | Number of input message envelopes processed. | |
| process-null-envelopes | Number of times no input message envelopes was available for the run loop to process. | |
| event-loop-utilization | The duty-cycle of the event loop. That is, the fraction of time of each event loop iteration that is spent in process(), window(), and commit. | |
| disk-usage-bytes | Total disk space size used by key-value stores (in bytes). | |
| disk-quota-bytes | Disk memory usage quota for key-value stores (in bytes). | |
| executor-work-factor | The work factor of the run loop. A work factor of 1 indicates full throughput, while a work factor of less than 1 will introduce delays into the execution to approximate the requested work factor. The work factor is set by the disk space monitor in accordance with the disk quota policy. Given the latest percentage of available disk quota, this policy returns the work factor that should be applied. | |
| total-process-cpu-usage | The process cpu usage percentage (in the [0, 100] interval) used by the Samza container process and all its child processes. | |
| physical-memory-mb | The physical memory used by the Samza container process (native + on heap) (in MBs). | |
| physical-memory-utilization | The ratio between the physical memory used by the Samza container process (native + on heap) and the total physical memory of the Samza container. | |
| container-thread-pool-size | The current size of a Samza container’s thread pool. It may or may not be the same as job.container.thread.pool.size, depending on the implementation. | |
| container-active-threads | The approximate actively used threads in a Samza container’s thread pool. | |
| <TaskName>-<StoreName>-restore-time | Time taken to restore task stores (per task store). |
| Group | Metric name | Meaning |
|---|---|---|
| Job-Coordinator Metrics (Gauge) | <system>-<stream>-partitionCount | The current number of partitions detected by the Stream Partition Count Monitor. This can be enabled by configuring job.coordinator.monitor-partition-change to true. |
| Group | Metric name | Meaning |
|---|---|---|
| TaskInstance Metrics (Counters and Gauges) | <system>-<stream>-<partition>-offset | The offset of the last processed message on the given system-stream-partition input. |
| commit-calls | Number of commit calls for the task. Each commit call involves checkpointing inputs (and flushing producers, checkpointing KV stores, flushing side input stores). | |
| window-calls | In case of WIndowableTask, the number of window() invocations on the task. | |
| process-calls | Number of process method calls. | |
| send-calls | Number of send method calls (representing number of messages that were sent to the underlying SystemProducers) | |
| flush-calls | Number of times the underlying system producers were flushed. | |
| messages-actually-processed | Number of messages processed by the task. | |
| pending-messages | Number of pending messages in the pending envelope queue | |
| messages-in-flight | Number of input messages currently being processed. This is impacted by the task.max.concurrency configuration. | |
| async-callback-complete-calls | Number of processAsync invocations that have completed (applicable to AsyncStreamTasks). |
| Group | Metric name | Meaning |
|---|---|---|
| OffsetManagerMetrics (Gauge) | <system>-<stream>-<partition>-checkpointed-offset | Latest checkpointed offsets for each input system-stream-partition. |
| Group | Metric name | Meaning |
|---|---|---|
| JvmMetrics (Timers) | gc-time-millis | Total time spent in GC. |
| <gc-name>-time-millis | Total time spent in garbage collection (for each garbage collector) (in milliseconds) |
| Group | Metric name | Meaning |
|---|---|---|
| JvmMetrics (Counters and Gauges) | gc-count | Number of GC invocations. |
| mem-heap-committed-mb | Size of committed heap memory (in MBs) Because the guest allocates memory lazily to the JVM heap and because the difference between Free and Used memory is opaque to the guest, the guest commits memory to the JVM heap as it is required. The Committed memory, therefore, is a measure of how much memory the JVM heap is really consuming in the guest.https://pubs.vmware.com/vfabric52/index.jsp?topic=/com.vmware.vfabric.em4j.1.2/em4j/conf-heap-management.html | |
| mem-heap-used-mb | Used memory from the perspective of the JVM is (Working set + Garbage) and Free memory is (Current heap size – Used memory). | |
| mem-heap-max-mb | Size of maximum heap memory (in MBs). This is defined by the –Xmx option. | |
| mem-nonheap-committed-mb | Size of non-heap memory committed in MBs. | |
| mem-nonheap-used-mb | Size of non-heap memory used in MBs. | |
| mem-nonheap-max-mb | Size of non-heap memory in MBs. This can be changed using –XX:MaxPermSize VM option. | |
| threads-new | Number of threads not started at that instant. | |
| threads-runnable | Number of running threads at that instant. | |
| threads-timed-waiting | Current number of timed threads waiting at that instant. A thread in TIMED_WAITING stated as: "A thread that is waiting for another thread to perform an action for up to a specified waiting time is in this state." | |
| threads-waiting | Current number of waiting threads. | |
| threads-blocked | Current number of blocked threads. | |
| threads-terminated | Current number of terminated threads. | |
| <gc-name>-gc-count | Number of garbage collection calls (for each garbage collector). | |
| (Emitted only if the OS supports it) | process-cpu-usage | Returns the "recent cpu usage" for the Java Virtual Machine process. |
| (Emitted only if the OS supports it) | system-cpu-usage | Returns the "recent cpu usage" for the whole system. |
| (Emitted only if the OS supports it) | open-file-descriptor-count | Count of open file descriptors. |
| Group | Metric name | Meaning |
|---|---|---|
| SystemConsumersMetrics (Counters and Gauges) These metrics are emitted when multiplexing and coordinating between per-system consumers and message choosers for polling |
chose-null | Number of times the message chooser returned a null message envelope. This is typically indicative of low input traffic on one or more input partitions. |
| chose-object | Number of times the message chooser returned a non-null message envelope. | |
| deserialization-error | Number of times an incoming message was not deserialized successfully. | |
| ssps-needed-by-chooser | Number of systems for which no buffered message exists, and hence these systems need to be polled (to obtain a message). | |
| poll-timeout | The timeout for polling at that instant. | |
| unprocessed-messages | Number of unprocessed messages buffered in SystemConsumers. | |
| <system>-polls | Number of times the given system was polled | |
| <system>-ssp-fetches-per-poll | Number of partitions of the given system polled at that instant. | |
| <system>-messages-per-poll | Number of times the SystemConsumer for the underlying system was polled to get new messages. | |
| <system>-<stream>-<partition>-messages-chosen | Number of messages that were chosen by the MessageChooser for particular system stream partition. |
| Group | Metric name | Meaning |
|---|---|---|
| SystemConsumersMetrics (Timers) | poll-ns | Average time spent polling all underlying systems for new messages (in nanoseconds). |
| deserialization-ns | Average time spent deserializing incoming messages (in nanoseconds). |
| Group | Metric name | Meaning |
|---|---|---|
| KafkaSystemConsumersMetrics (Timers) | <system>-<topic>-<partition>-offset-change | The next offset to be read for this topic and partition. |
| <system>-<topic>-<partition>-bytes-read | Total size of all messages read for a topic partition (payload + key size). | |
| <system>-<topic>-<partition>-messages-read | Number of messages read for a topic partition. | |
| <system>-<topic>-<partition>-high-watermark | Offset of the last committed message in Kafka's topic partition. | |
| <system>-<topic>-<partition>-messages-behind-high-watermark | Number of input messages waiting to be processed on an input topic-partition. That is, the difference between high watermark and next offset. | |
| <system>-<host>-<port>-reconnects | Number of reconnects to a broker on a particular host and port. | |
| <system>-<host>-<port>-bytes-read | Total size of all messages read from a broker on a particular host and port. | |
| <system>-<host>-<port>-messages-read | Number of times the consumer used a broker on a particular host and port to get new messages. | |
| <system>-<host>-<port>-skipped-fetch-requests | Number of times the fetchMessage method is called but no topic/partitions needed new messages. | |
| <system>-<host>-<port>-topic-partitions | Number of broker's topic partitions which are being consumed. | |
| poll-count | Number of polls the KafkaSystemConsumer performed to get new messages. | |
| no-more-messages-SystemStreamPartition [<system>, <stream>, <partition>] | Indicates if the Kafka consumer is at the head for particular partition. 1 if it is caught up, 0 otherwise. | |
| blocking-poll-count-SystemStreamPartition [<system>, <stream>, <partition>] | Number of times a blocking poll is executed (polling until we get at least one message, or until we catch up to the head of the stream) (per partition). | |
| blocking-poll-timeout-count-SystemStreamPartition [<system>, <stream>, <partition>] | Number of times a blocking poll has timed out (polling until we get at least one message within a timeout period) (per partition). | |
| buffered-message-count-SystemStreamPartition [<system>, <stream>, <partition>] | Current number of messages in queue (per partition). | |
| buffered-message-size-SystemStreamPartition [<system>, <stream>, <partition>] | Current size of messages in queue (if systems.system.samza.fetch.threshold.bytes is defined) (per partition). | |
| <system>-<topic>-<partition>-offset-change | The next offset to be read for a topic partition. | |
| <system>-<topic>-<partition>-bytes-read | Total size of all messages read for a topic partition (payload + key size). |
| Group | Metric name | Meaning |
|---|---|---|
| SystemProducersMetrics (Counters and Gauges) These metrics are aggregated across Producers. |
sends | Number of send method calls. Representing total number of sent messages. |
| flushes | Number of flush method calls for all registered producers. | |
| <source>-sends | Number of sent messages for a particular source (task instance). | |
| <source>-flushes | Number of flushes for particular source (task instance). | |
| serialization error | Number of errors occurred while serializing envelopes before sending. |
| Group | Metric name | Meaning |
|---|---|---|
| KafkaSystemProducersMetrics (Counters) | <system>-producer-sends | Number of send invocations to the KafkaSystemProducer. |
| <system>-producer-send-success | Number of send requests that were successfully completed by the KafkaSystemProducer. | |
| <system>-producer-send-failed | Number of send requests to Kafka (e.g., output topics) that failed due to unrecoverable errors | |
| <system>-flushes | Number of calls made to flush in the KafkaSystemProducer. | |
| <system>-flush-failed | Number of times flush operation failed. |
| Group | Metric name | Meaning |
|---|---|---|
| KafkaSystemProducersMetrics (Timers) | <system>-flush-ns | Represents average time the flush call takes to complete (in nanoseconds). |
| Group | Metric name | Meaning |
|---|---|---|
| KeyValueStorageEngineMetrics (Counters) These metrics provide insight into the type and number of KV Store operations taking place |
<store-name>-puts | Total number of put operations on the given KV store. |
| <store-name>-put-alls | Total number putAll operations on the given KV store. | |
| <store-name>-gets | Total number get operations on the given KV store. | |
| <store-name>-get-alls | Total number getAll operations on the given KV store. | |
| <store-name>-alls | Total number of accesses to the iterator on the given KV store. | |
| <store-name>-ranges | Total number of accesses to a sorted-range iterator on the given KV store. | |
| <store-name>-deletes | Total number delete operations on the given KV store. | |
| <store-name>-delete-alls | Total number deleteAll operations on the given KV store. | |
| <store-name>-flushes | Total number flush operations on the given KV store. | |
| <store-name>-restored-messages | Number of entries in the KV store restored from the changelog for that store. | |
| <store-name>-restored-bytes | Size in bytes of entries in the KV store restored from the changelog for that store. | |
| <store-name>-snapshots | Total number of snapshot operations on the given KV store. |
| Group | Metric name | Meaning |
|---|---|---|
| KeyValueStorageEngineMetrics (Timers) These metrics provide insight into the latencies of of KV Store operations |
<store-name>-get-ns | Average duration of the get operation on the given KV Store. |
| <store-name>-get-all-ns | Average duration of the getAll operation on the given KV Store. | |
| <store-name>-put-ns | Average duration of the put operation on the given KV Store. | |
| <store-name>-put-all-ns | Average duration of the putAll operation on the given KV Store. | |
| <store-name>-delete-ns | Average duration of the delete operation on the given KV Store. | |
| <store-name>-delete-all-ns | Average duration of the deleteAll operation on the given KV Store. | |
| <store-name>-flush-ns | Average duration of the flush operation on the given KV Store. | |
| <store-name>-all-ns | Average duration of obtaining an iterator (using the all operation) on the given KV Store. | |
| <store-name>-range-ns | Average duration of obtaining a sorted-range iterator (using the all operation) on the given KV Store. | |
| <store-name>-snapshot-ns | Average duration of the snapshot operation on the given KV Store. |
| Group | Metric name | Meaning |
|---|---|---|
| KeyValueStoreMetrics (Counters) These metrics are measured at the App-facing layer for different KV Stores, e.g., RocksDBStore, InMemoryKVStore. |
<store-name>-gets, <store-name>-getAlls, <store-name>-puts, <store-name>-putAlls, <store-name>-deletes, <store-name>-deleteAlls, <store-name>-alls, <store-name>-ranges, <store-name>-flushes | Total number of the specified operation on the given KV Store.(These metrics have are equivalent to the respective ones under KeyValueStorageEngineMetrics). |
| bytes-read | Total number of bytes read (when serving reads – gets, getAlls, and iterations). | |
| bytes-written | Total number of bytes written (when serving writes – puts, putAlls). |
| Group | Metric name | Meaning |
|---|---|---|
| SerializedKeyValueStoreMetrics (Counters) These metrics are measured at the serialization layer. |
<store-name>-gets, <store-name>-getAlls, <store-name>-puts, <store-name>-putAlls, <store-name>-deletes, <store-name>-deleteAlls, <store-name>-alls, <store-name>-ranges, <store-name>-flushes | Total number of the specified operation on the given KV Store. (These metrics have are equivalent to the respective ones under KeyValueStorageEngineMetrics) |
| bytes-deserialized | Total number of bytes deserialized (when serving reads – gets, getAlls, and iterations). | |
| bytes-serialized | Total number of bytes serialized (when serving reads and writes – gets, getAlls, puts, putAlls). In addition to writes, serialization is also done during reads to serialize key to bytes for lookup in the underlying store. |
| Group | Metric name | Meaning |
|---|---|---|
| LoggedStoreMetrics (Counters) These metrics are measured at the changeLog-backup layer for KV stores. |
<store-name>-gets, <store-name>-puts, <store-name>-alls, <store-name>-deletes, <store-name>-flushes, <store-name>-ranges, | Total number of the specified operation on the given KV Store. |
| Group | Metric name | Meaning |
|---|---|---|
| CachedStoreMetrics (Counters and Gauges) These metrics are measured at the caching layer for RocksDB-backed KV stores. |
<store-name>-gets, <store-name>-puts, <store-name>-alls, <store-name>-deletes, <store-name>-flushes, <store-name>-ranges, | Total number of the specified operation on the given KV Store. |
| cache-hits | Total number of get and getAll operations that hit cached entries. | |
| put-all-dirty-entries-batch-size | Total number of dirty KV-entries written-back to the underlying store. | |
| dirty-count | Number of entries in the cache marked dirty at that instant. | |
| cache-count | Number of entries in the cache at that instant. |
| Group | Metric name | Meaning |
|---|---|---|
| RoundRobinChooserMetrics (Counters) | buffered-messages | Size of the queue with potential messages to process. |
| Group | Metric name | Meaning |
|---|---|---|
| BatchingChooserMetrics (Counters and gauges) | batch-resets | Number of batch resets because they exceeded the max batch size limit. |
| batched-envelopes | Number of envelopes in the batch at the current instant. |
| Group | Metric name | Meaning |
|---|---|---|
| BootstrappingChooserMetrics (Gauges) | lagging-batch-streams | Number of bootstrapping streams that are lagging. |
| <system>-<stream>-lagging-partitions | Number of lagging partitions in the stream (for each stream marked as bootstrapping stream). |
| Group | Metric name | Meaning |
|---|---|---|
| HdfsSystemProducerMetrics (Counters) | system-producer-sends | Total number of attempts to write to HDFS. |
| system-send-success | Total number of successful writes to HDFS. | |
| system-send-failed | Total number of failures while sending envelopes to HDFS. | |
| system-flushes | Total number of attempts to flush data to HDFS. | |
| system-flush-success | Total number of successfully flushed all written data to HDFS. | |
| system-flush-failed | Total number of failures while flushing data to HDFS. |
| Group | Metric name | Meaning |
|---|---|---|
| HdfsSystemProducerMetrics (Timers) | system-send-ms | Average time spent for writing messages to HDFS (in milliseconds). |
| system-flush-ms | Average time spent for flushing messages to HDFS (in milliseconds). |
| Group | Metric name | Meaning |
|---|---|---|
| ElasticsearchSystemProducerMetrics (Counters) | system-bulk-send-success | Total number of successful bulk requests |
| system-docs-inserted | Total number of documents created. | |
| system-docs-updated | Total number of documents updated. | |
| system-version-conflicts | Number of times the failed requests due to conflicts with the current state of the document. |